
Rolling Forecast vs Annual Budget: Why Finance Teams Are Finally Making the Switch
Learn why finance teams are replacing annual budgets with rolling forecasts, plus best practices, examples, and software tips for continuous planning.
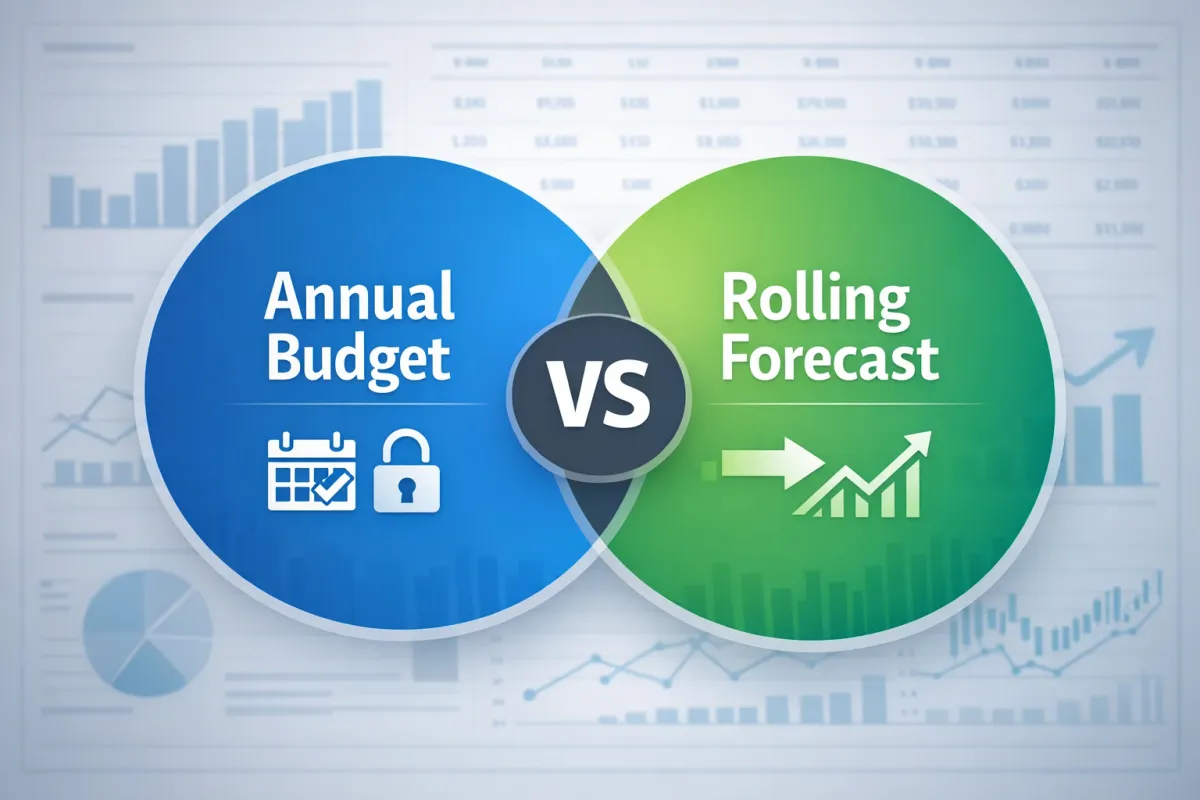
Every year, the same thing happens.
Finance spends two or three months building the annual budget. Endless meetings. Department heads negotiating their numbers. Spreadsheets flying back and forth. By the time it’s approved, everyone’s exhausted and slightly resentful.
Then Q1 closes, something changes—a big customer churns, a new product launches early, macroeconomic conditions shift—and suddenly the budget is already wrong.
But you’re stuck with it. For the next nine months, every variance explanation is some version of “well, we didn’t anticipate this back in October.” Leadership starts ignoring the budget entirely. FP&A becomes the team that explains why reality doesn’t match a plan nobody believes in anymore.
Here’s what changes when you switch to rolling forecasts: Finance teams report spending significantly less time on variance explanations and more bandwidth for strategic analysis. Department heads stop gaming their numbers because the forecast isn’t a locked target anymore. And when leadership asks “where are we headed?”—you have an answer that isn’t six months out of date.
This is why continuous planning is replacing traditional annual budgets at companies that want their FP&A team focused on the future instead of defending the past.
What Is a Rolling Forecast?
Rolling forecast definition: A rolling forecast is a financial planning approach that updates monthly or quarterly, continuously extending the forecast horizon so businesses always have an up-to-date view of the next 12–18 months.
Here’s how it works: When January closes, you add January actuals to your model and extend the forecast by adding a new month at the end. You’re always looking 12 or 18 months ahead with current assumptions, not assumptions you made last September.
The forecast never goes stale. You’re never stuck explaining variance to a budget that everyone stopped believing in by March.
Rolling Forecast vs Budget in One Sentence:
Budget = fixed annual target
Forecast = living decision tool
| Feature | Annual Budget | Rolling Forecast |
|---|---|---|
| Update Frequency | Once per year | Monthly/Quarterly |
| Planning Horizon | Fixed fiscal year | Always 12–18 months ahead |
| Primary Use | Target setting | Decision-making |
| Flexibility | Low | High |
| Tool Requirements | Spreadsheet-friendly at small scale | Better with a planning platform |
| Focus | Variance explanation | Forward visibility |
That’s the concept. The execution is where most teams either level up their FP&A function or create process bottlenecks.
Why finance leaders are moving to rolling forecasts:
Executives want forward visibility, not backward explanations. The CFO doesn’t care why you missed budget if the budget was wrong to begin with. They care where the business is actually going so they can make decisions that matter. Rolling forecasts answer that question directly.
Annual budgets create perverse incentives. Once a number is locked, people manage to it—sometimes in ways that actively hurt the business. Sandbagging in September so you can beat your target in March. Rushing Q4 spend because “use it or lose it.” Rolling forecasts shift the conversation from “hit your number” to “what’s really happening and what should we do about it.”
Your business doesn’t operate on fiscal calendar years. Customers don’t wait until January to change their buying behavior. Product launches don’t care about your budget cycle. Why should your financial planning process pretend they do?
Scenario planning actually becomes useful. When your forecast is a living document that updates with real data, you can run driver-based forecasting and see ripple effects across the P&L. In a static annual budget, scenarios are just Excel math that nobody trusts.
Rolling Forecast Example: Simple 12-Month Model
Here’s what a basic rolling forecast model looks like in practice:
Example month: February
Your rolling 12-month forecast shows: March through next February
What happens when March closes:
- Add March actuals to the model
- Drop March from the forecast
- Add next March to the end
- Update assumptions based on current trends
Your forecast now shows: April through next March
| Component | How It Updates |
|---|---|
| Revenue | Pipeline coverage, recent close rates, churn trends |
| Headcount | Approved reqs, actual hire dates, attrition rate |
| Operating Expenses | Run-rate from actuals, upcoming renewals, project spending |
| Cash Position | Collections trends, payment schedules, burn rate |
The key difference from budgeting vs forecasting: your assumptions stay current. You’re not defending a revenue number you picked when your pipeline looked completely different.
Why Most Rolling Forecast Implementations Fail
Rolling forecasts sound great in theory. In practice, most teams try to implement continuous planning and within six months the process expands, cycle time increases, and analyst workload spikes.
Why? Because if running one annual budget cycle in Excel is painful, running twelve monthly forecast updates is twelve times more painful.
Think about what a rolling forecast process actually requires:
Every month (or quarter), you’re collecting inputs from department heads. You’re consolidating numbers from multiple sources—actuals from the ERP, pipeline data from Salesforce, headcount from Workday. You’re reconciling version conflicts. You’re comparing this forecast to last month’s forecast to actuals to the budget that leadership still references sometimes. You’re trying to explain what changed and why and whether it matters.
Now imagine doing that not once a year, but continuously. Every. Single. Month.
Without the right FP&A automation, rolling forecasts become a planning treadmill. Your team spends so much time running the process that they don’t have time to actually analyze anything. You haven’t improved the quality of financial planning. You’ve just created more work.
This is where most rolling forecast implementations fail. Not because the concept is wrong, but because the tooling can’t support the process.
If you’re currently stuck in Excel and considering a switch to dedicated FP&A forecasting software, see how teams handle version control and workflow in platforms built for continuous planning →
How to Actually Make Rolling Forecasts Work
If you’re thinking about moving to a rolling forecast model, these things will make or break you:
Start simple. You don’t need to forecast every line item monthly. Pick your key drivers—maybe 10 or 15 metrics that actually move the needle—and forecast those with higher frequency. Revenue drivers, headcount, major expense categories. The rest can stay quarterly until you’ve got the rolling forecast process running smoothly.
Pick a realistic cadence. Monthly rolling forecasts are great if you have the infrastructure. If you don’t, start with quarterly updates on a rolling 12-month horizon. You can tighten the forecast cycle later once you’re not dealing with forecast fatigue.
Version control is non-negotiable. You need to see what changed between forecast versions, who changed it, and why. If you can’t answer “why is this revenue number different from last month?” in under two minutes, you’re going to have a bad time in front of leadership. Excel can work early on, but it breaks down fast once forecasts become continuous and collaborative.
Scenario comparison has to be easy. The whole point of rolling forecasts is agility. If running a “what if revenue drops 10%” scenario takes a week, you’re not actually more agile—you just have more frequent forecasts.
Move beyond Excel for the planning process. Excel is genuinely great for analysis and ad hoc modeling. But it’s not designed as a collaborative planning system. It doesn’t handle versioning well, struggles with multi-user input, and provides no audit trail. You can make it work for annual budgets if you’re careful. For continuous planning with rolling forecasts, most teams eventually move to dedicated FP&A software.
The teams I’ve seen succeed all made the same move: they kept Excel for analysis but moved the actual planning process into a platform that handles version control and workflow properly.
Rolling Forecast Best Practices for FP&A Teams
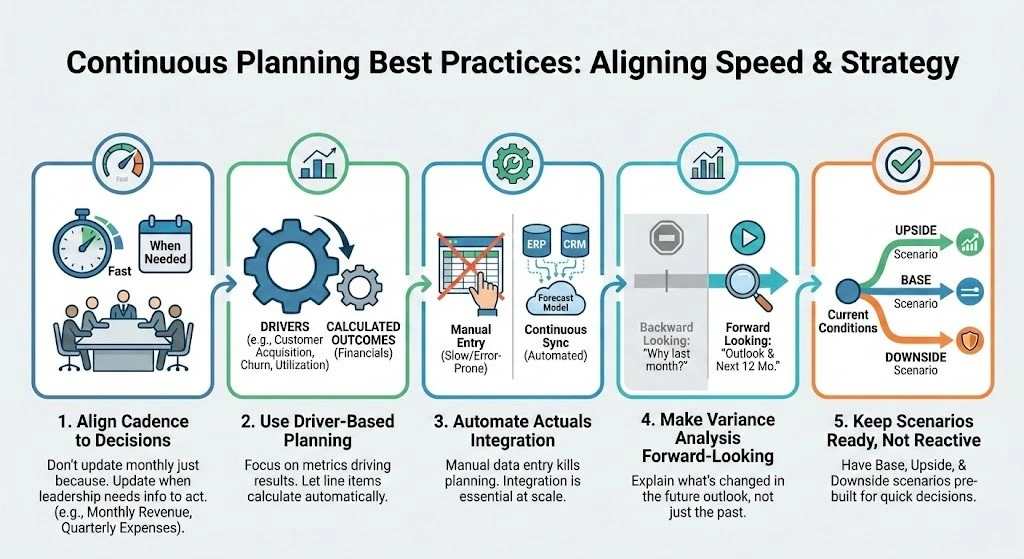
Align forecast cadence to decision-making speed
Don’t update monthly just because you can. Update when leadership needs the information to make decisions. Fast-moving businesses might need monthly revenue forecasts but only quarterly expense updates.
Use driver-based planning instead of line-item guessing
Focus on the metrics that actually drive financial outcomes—customer acquisition, churn rate, average deal size, headcount, utilization rates. Let the line items calculate from the drivers.
Automate actuals integration from ERP and CRM
Manual data entry kills continuous planning. If you’re copying actuals from your ERP into your forecast model every month, you’re setting yourself up to fail. Integration isn’t optional at scale.
Make variance analysis forward-looking
Stop explaining why last month was different. Start explaining what’s changed in the outlook and what it means for the next 12 months.
Keep scenarios ready, not reactive
Don’t build your downside case when revenue starts falling. Have base, upside, and downside scenarios ready so you can make decisions quickly when conditions change.
Rolling Forecast Metrics Finance Teams Should Focus On
You can’t forecast everything with high frequency. These are the driver-based forecasting metrics most FP&A teams prioritize:
Revenue & Growth
- ARR or recurring revenue
- Pipeline coverage (3x, 4x, etc.)
- Win rates and deal velocity
- Customer churn and expansion
People & Capacity
- Headcount by department
- Open requisitions and hire dates
- Fully-loaded cost per employee
- Revenue per employee
Profitability & Burn
- Gross margin percentage
- Operating expense run-rate
- EBITDA or adjusted EBITDA
- Monthly cash burn
Operational Health
- Days sales outstanding (DSO)
- Customer acquisition cost (CAC)
- Lifetime value (LTV)
- Magic number or efficiency ratio
These metrics give you 80% of the insight with 20% of the forecasting effort. The rest can stay quarterly or even annual.
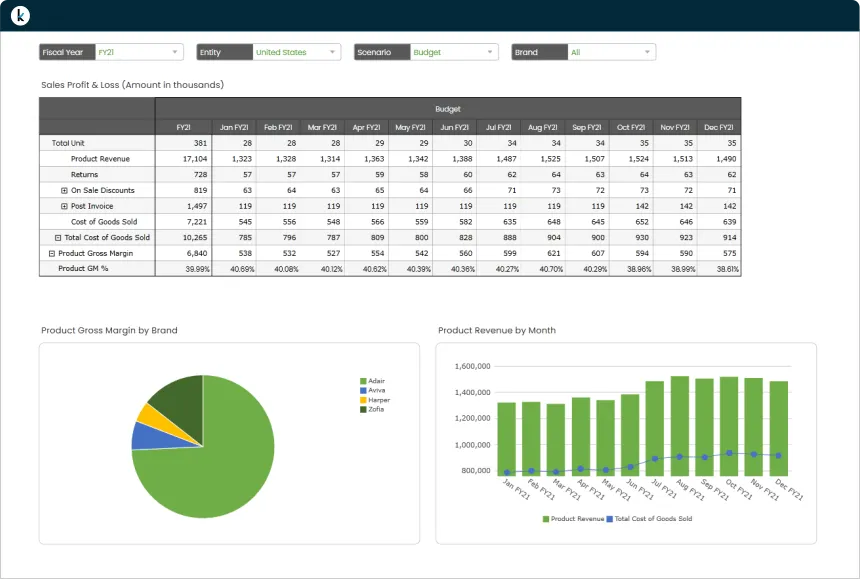
How Financial Planning Software Makes This Actually Work
Kepion was built specifically for this problem. It’s an FP&A forecasting software platform that sits underneath your BI layer—so if you’re already using Power BI for financial planning, your dashboards don’t change. Your executives keep seeing the same reports. You just stop spending your life consolidating spreadsheets.
For the rolling forecast process specifically:
Version management that actually works. Every forecast is saved, timestamped, and comparable. When the CFO asks “what changed from last month?”—you pull up a version comparison and show them in real time.
Multi-user input without the chaos. Department heads enter forecasts directly with appropriate permissions. No more emailing templates back and forth or wondering which version is final.
Scenario modeling that doesn’t require copying your entire rolling forecast model. Build and compare base case vs. downside vs. stretch in a few clicks, not a few days.
Native Power BI integration. Kepion runs on Azure and SQL Server and connects directly to Power BI. No middleware. Your Power BI reports just start showing better data because they’re pulling from a real planning database instead of consolidated Excel files.
Real results: Some teams report cutting forecast cycle time from over a week to just a few days per cycle after moving off spreadsheets. Same forecast quality, same detail level, significantly less process work.
That’s the difference between a team that does planning and a team that drowns in it.
Bottom Line
Rolling forecasts are genuinely a better way to run FP&A for most companies. They keep leadership focused on where the business is actually going instead of why you missed a number you set eight months ago. They make finance a strategic partner instead of a scorekeeper.
But without the right system and FP&A automation tools, they can pull FP&A away from decision support and into process management.
If you’re thinking about making the switch—or if you’ve tried continuous planning before and it turned into a nightmare—it’s worth seeing how a real financial planning platform handles version control, workflow, and scenario management.
See a live rolling forecast model in Power BI with version control, workflow, and scenarios already built. Book a 30-minute working session here and we’ll walk through exactly how driver-based planning and integration work in practice.
TL;DR: Rolling Forecasts vs Annual Budgets
The Problem: Annual budgets become obsolete by Q1. Finance teams waste time explaining variances to six-month-old assumptions while leadership ignores the budget entirely.
The Solution: Rolling forecasts extend your planning horizon every month or quarter, so you’re always looking 12-18 months ahead with current data instead of stale assumptions.
Why It Matters: Teams using rolling forecasts and continuous planning spend significantly less time on variance explanations and more time on strategic analysis. Finance becomes a strategic partner, not a scorekeeper.
The Challenge: Most implementations fail because Excel can’t handle the workload. Running monthly forecast cycles in spreadsheets increases cycle time and analyst workload within six months.
What Works: Dedicated FP&A forecasting software with proper version control, multi-user workflow, and scenario modeling. Teams using platforms built for continuous planning have dramatically reduced forecast cycle time while maintaining quality and detail.
The Fix: Start with quarterly rolling forecasts on your key drivers (10-15 metrics). Use proper financial planning software that integrates with your existing BI stack. Tighten the cycle once the process is stable.
Bottom Line: Rolling forecasts are better than annual budgets, but only if you have the right tools. Without proper FP&A automation and driver-based planning, you’re just creating more work instead of better planning.
Keep reading
More from the Kepion blog



Kepion Platform
Continuous, AI-driven planning on Microsoft Fabric.
Pre-built where your actuals already live. Book a working session and see it against your data.