
Beautiful Power BI Dashboards, But at What Cost

FP&A teams seems to always run into the same issues time and time again. The dashboards are polished. Leadership is happy. And behind the scenes, someone is staying late every month copy-pasting numbers between spreadsheets and praying nothing breaks before the board meeting.
Power BI gets all the credit. Excel does all the work. And the FP&A team carries all the risk.
The Dirty Secret
Nobody talks about this part, but here’s how forecasting actually works at most companies:
Finance sends out templates. Business units fill them in (late, usually, and sometimes in the wrong format). Someone on the FP&A team—probably the most junior person, or whoever drew the short straw—spends two days consolidating everything into the master model. There’s always at least one version conflict. There’s always a number that doesn’t tie out. And there’s always a frantic email chain trying to figure out which file is the “real” one.
Then the final numbers get pushed into Power BI, the dashboards refresh, and suddenly everything looks buttoned-up and professional.
The executives see the polished output. They don’t see the chaos that produced it.
I’m Not Saying Power BI Is Bad
Power BI is great at what it does. It connects to data sources, it builds visualizations, it lets people self-serve on reports. For BI and analytics, it’s solid.
But it’s not a planning tool. It doesn’t manage forecast inputs. It doesn’t track versions. It doesn’t let you run scenarios and compare them side by side. It doesn’t give you an audit trail when someone asks “wait, why did this number change from last month?”
So what happens? You build the planning process around it using Excel. Lots of Excel. And then you spend half your time managing the Excel instead of doing actual analysis.
The Part That Keeps People Up at Night
Here’s what I hear most often: “I’m not confident in my own numbers.”
Not because they’re bad at their jobs. Because the process makes it almost impossible to be confident. When your forecast is stitched together from 15 different spreadsheets that 8 different people touched, and there’s no real version control, and the documentation is basically “ask Janet, she remembers how this works”—you’re going to have doubts.
And those doubts get worse when you’re sitting in front of the CFO and someone asks a question you can’t answer quickly. Or when audit comes around and wants to see how a number was derived. Or when you realize, three months later, that a formula was broken the whole time.
What Actually Fixes This
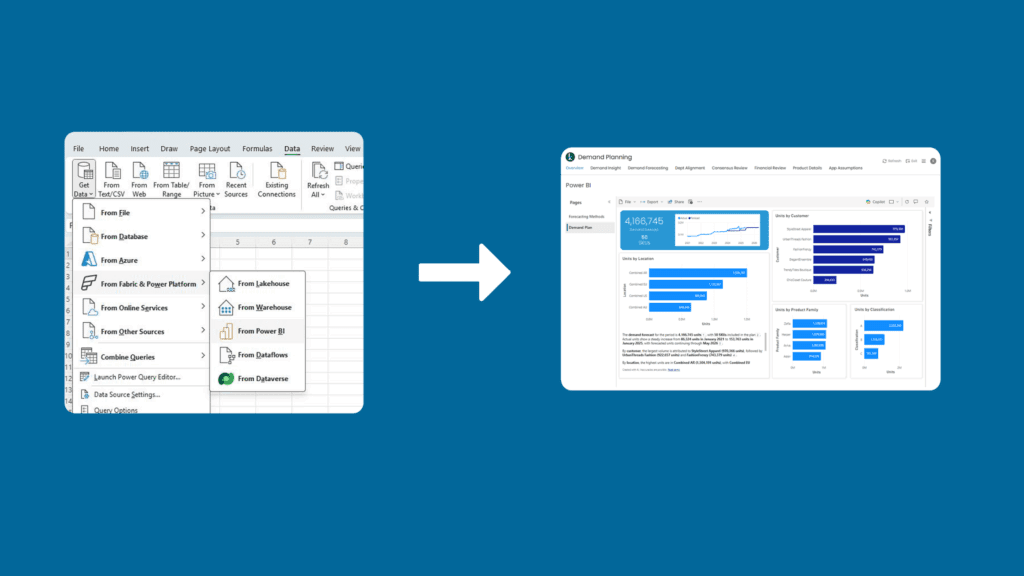
The answer isn’t more dashboards. The answer is fixing what happens before the data hits the dashboard.
You need an actual planning system—something that manages the inputs, tracks changes, handles scenarios, and gives you one version of the truth that everyone works from. Power BI stays your reporting layer. But instead of feeding it from a tangle of spreadsheets, you feed it from something designed for planning.
Kepion does this. It’s built on SQL Server and Azure, so if you’re already a Microsoft shop, it fits into what you have. Your Power BI dashboards don’t change. Your executives don’t notice anything different. You just stop spending half your month on data wrangling.
One company I know went from 12-day close cycles to 4-day close cycles after setting this up. Same team, same reports—they just eliminated all the manual reconciliation work.
Who Actually Needs This
Honestly? Not everyone. If you’ve got a simple forecasting process and a small team, you might be fine with Excel and elbow grease.
But if you’re doing rolling forecasts across multiple business units, if you’ve got scenario planning that lives in someone’s head instead of a system, if you dread audit season, if your models have gotten complex enough that only one person really understands them—you’ve probably outgrown the spreadsheet approach.
At that point it’s not about buying software. It’s about getting your weekends back and actually trusting the numbers you present.
Where Kepion Fits

Kepion was built for exactly this problem—adding a governed planning layer underneath your existing BI environment.
It integrates natively with Power BI, Azure, and SQL Server, so if you’re already running a Microsoft stack, there’s no middleware headache. Your dashboards stay the same. Your executives don’t need retraining. You’re just replacing the spreadsheet chaos with a system that handles version control, scenario management, and audit trails out of the box.
Most implementations take weeks rather than months, and you don’t have to tear down what’s already working to get there.
Keep reading
More from the Kepion blog



Kepion Platform
Continuous, AI-driven planning on Microsoft Fabric.
Pre-built where your actuals already live. Book a working session and see it against your data.